Analytics & Visualization Services
N|M Analytics & Visualization Services
N|M Analytics & Visualization Services enable our clients to turn their data into information that positively impacts every aspect of their organization (Customer Service, Sales, Acquisitions, Supply Chain, Operations, Growth, Performance, Human Resources). N|M analytics & visualization services empower our clients to Connect, Analyze, and Visualize their key metrics and KPIs. Building effective dashboards shouldn’t require high-priced engineers or an advanced degree to be understood and acted upon.
Our analytics & visualization services enrich our customer decision-making process to deliver predictable growth, outcomes and performance. Our clients gain the ability to build and measure KPIs, set alerts, share and collaborate with team members and never be in the dark again. Our goal is to remove the need to ask, “what’s the status.” Our dashboards give teams the business intelligence to boost performance and bring smiles across their organization.
Below are a few sample dashboards examples of N|M Analytics & Visualization Services:
Click on Picture to go to Full Screen
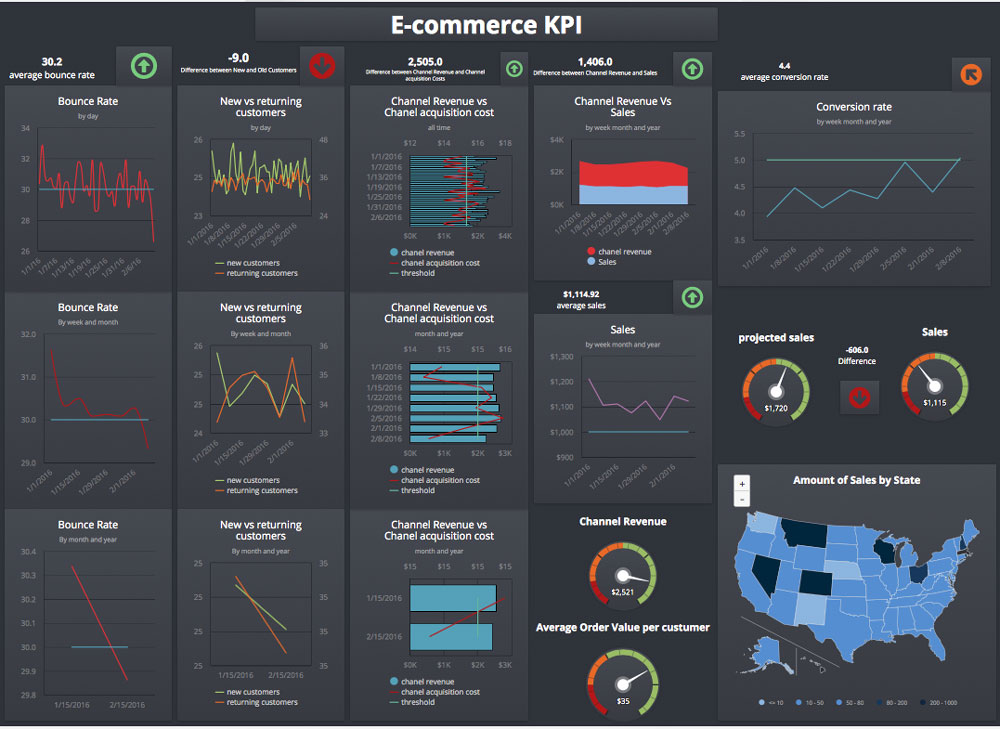
eCommerce KPI
Our interactive eCommerce KPI dashboards allow you to proactively measure your sales productive, gain insights into revenue patterns and help you better understand ROI in minutes. Don’t wait until the end of the month, quarter or year to figure out whether marketing campaigns or initiatives worked. Proactively tracks your efforts to see what is working so you can redirect your valuable resources where it matters to produce maximum returns. Our solution enables you to connect with your sales performance and see results at the speed of light.
Click on Picture to go to Full Screen
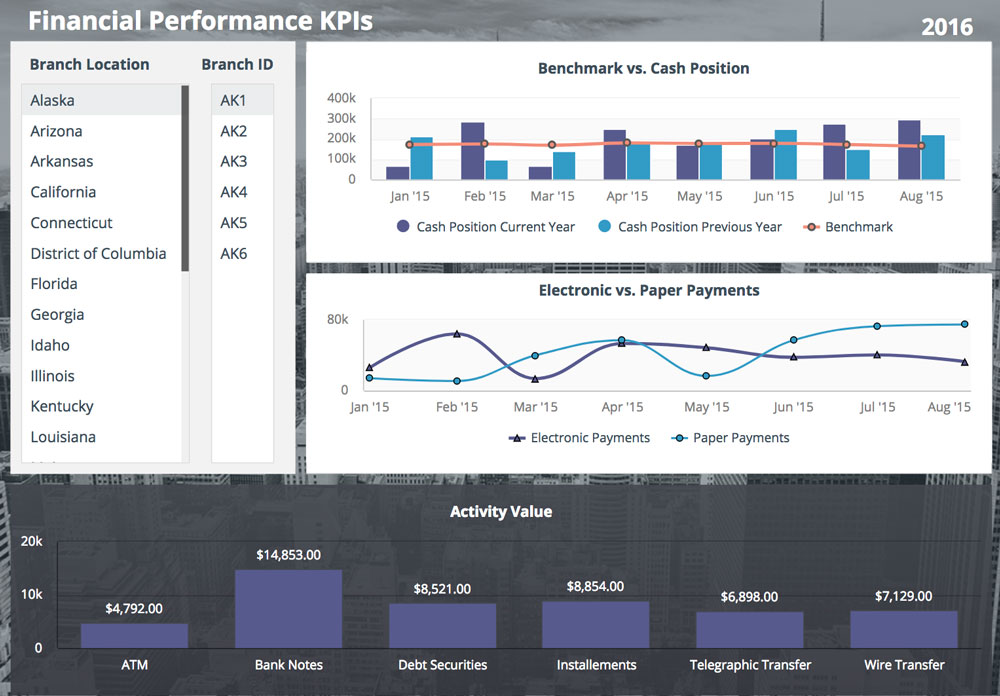
Financial Performance
N|M provides dynamic visualization solutions so our customers always know their financial position. Companies financial situations are fluid and constantly changing. Leaders should have insights into company financial trends to anticipate change and plan accordingly. Organizational leaders can miss opportunities to recognize and react to financial event if they only view financial information at a single point in time i.e. end of month, quarter or year. Don’t be reactive, but accelerate your company’s financial decisions and actions. We provide real-time insights that make a difference in your company’s financial health.
Click on Picture to go to Full Screen
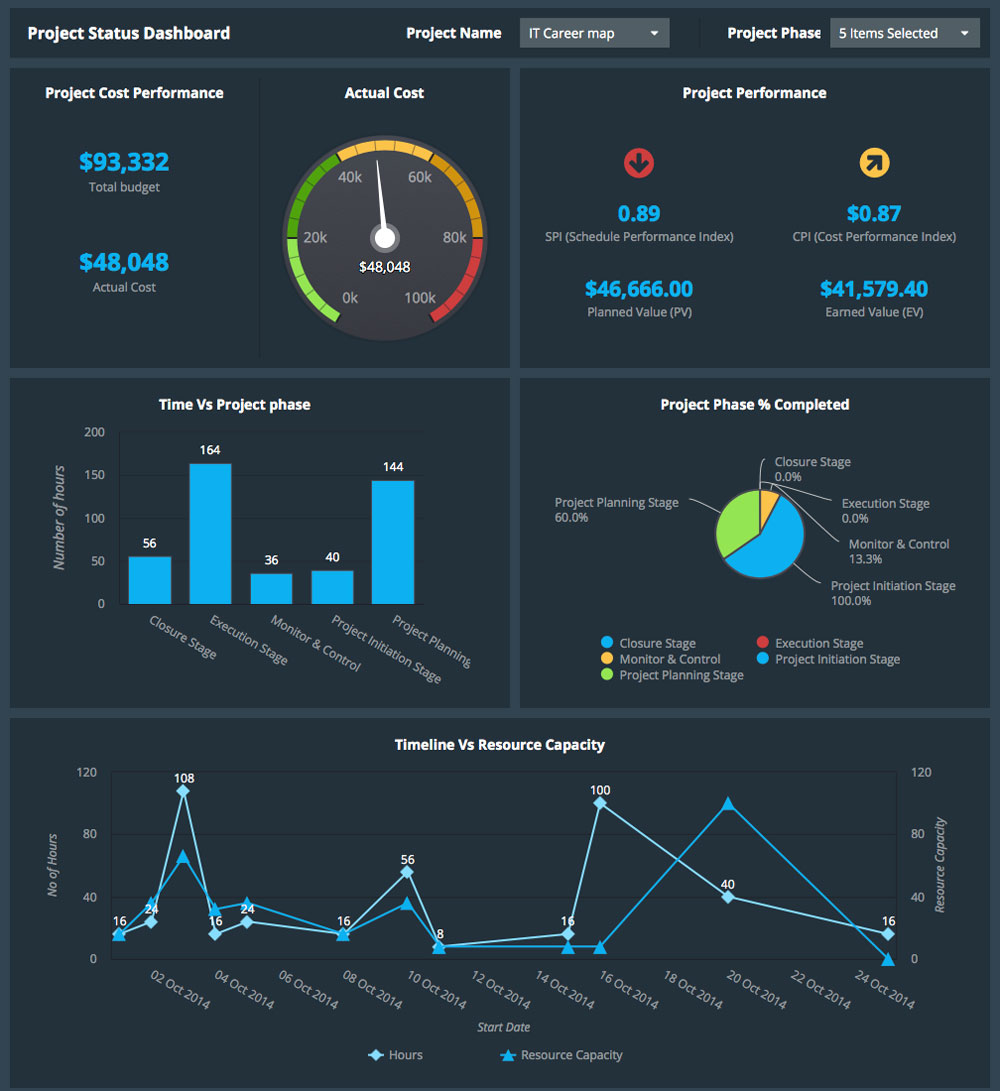
Project Status
Mesmerize your customers, project stakeholders and team members with detailed visual analysis of project performance. Equip your project teams with the ability to create dynamic and visually pleasing representation of their project performance. Easily build and display earned value management calculations, project labor levels, burn rates and other KPIs with easy to understand dashboards. Your project team will shine and standoff from the competition. Make analytics and visualization apart of your project management approach.
Click on Picture to go to Full Screen
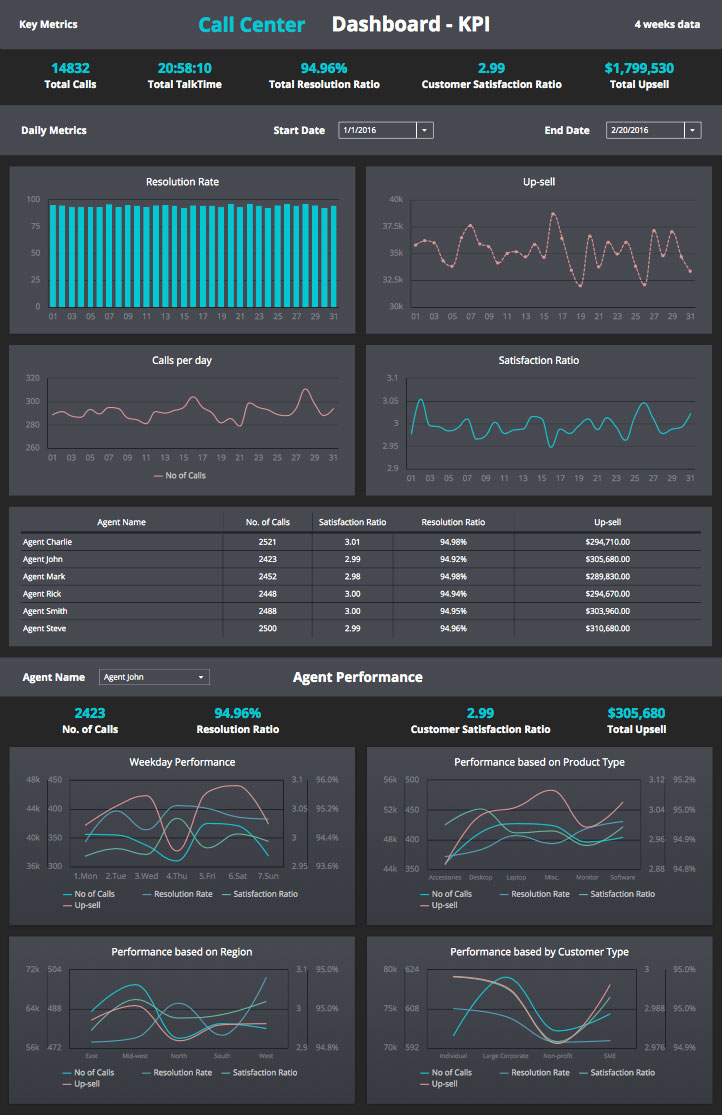
Call Center
Call Center efficiency is critical to high quality customer service. Analytics and Visualization enable your team to measure key performance indicator and act on the data. Dashboards display your team’s performance and enable them take ownership for call center performance. Leaders are enable to review performance in real-time to proactively identify and correct unwanted performance behavior that impact customer service, cost and other KPIs. By being made aware of the impact of this behavior, agents can self-correct to reduce time spent on calls during busy periods
Click on Picture to go to Full Screen
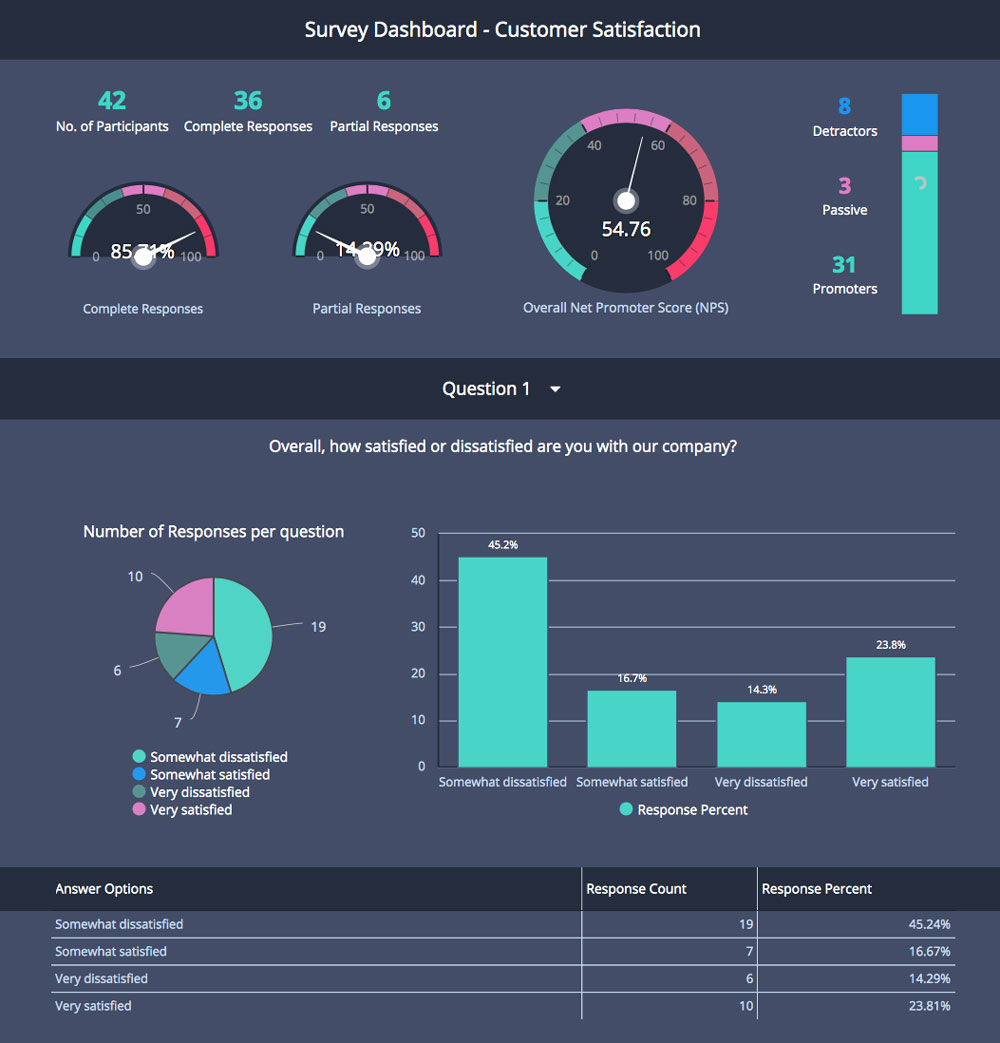
Customer Satisfaction Surveys
Customer satisfaction dashboards enable you to understand how your customers perceive your services and products like never before. In this highly competitive environment, if you don’t know your customers’ perception of the quality, effectiveness, and responsiveness of your service, you are at risk of losing a customer. Analyzing and displaying those results in a visual representation is a powerful way to assess what improvements need to be made in the organization’s processes, personnel, systems and other operational functions. Don’t wait to lose a customer before you seek learn their needs and business pains.
Try our Analytics & Visualization Services out for yourself